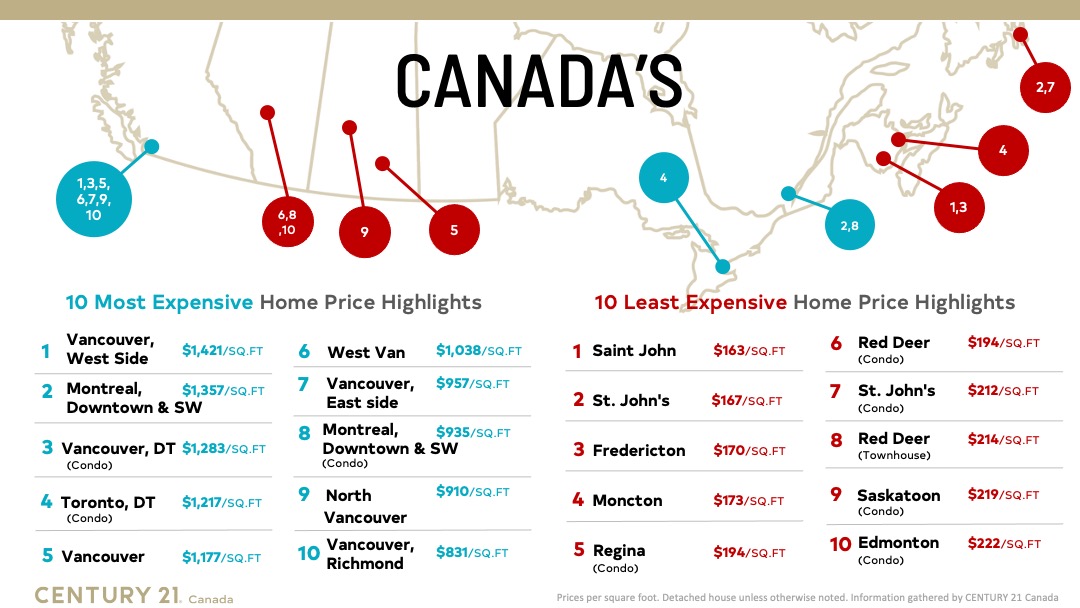
Vancouver (July 27, 2022) – While interest rates have been on the rise for the past few months, the Canadian housing landscape continued to see pricing growth during the first six months of this year. Prices were up particularly in suburbs and smaller communities outside metropolitan centres as more condo owners seek homes outside of the expensive Greater Toronto Area and Vancouver centres.
The sixth annual Price Per Square Foot survey released today by CENTURY 21 Canada shows that real estate continued to be a strong market for the first half of the year, with long-term growth continuing despite higher interest rates and concerns about what that will mean for the industry in the immediate future. While some markets have cooled after the boom that occurred during the COVID-19 pandemic, prices overall have continued to remain elevated for the start of the year.
In its annual, nationwide study, CENTURY 21 Canada compared the price per square foot of properties sold between January 1 and June 30 this year to the same period last year and in previous years.
“We recognize the concerns that some might have because of interest rates, but the first half of 2022 showed growth in nearly every regional market in the country,” says Brian Rushton, Chief Operating Officer of CENTURY 21 Canada. “The highest point of the boom may have passed, but the trend is still towards higher prices, especially in suburbs where younger and first-time home buyers are looking to escape competitive metropolitan areas now that remote work has become more common. What will be interesting is to compare the data we’ve received from the first half of this year with the data we gather in 2023 to see how the rising rates impact the market for the next six months.”
After high prices in January across the board, prices saw market-typical fluctuations throughout the spring, with most markets experiencing slight downturns in June when the rate hikes came into effect. However, that has not stopped the demand for housing, particularly in the communities of Hamilton, Kitchener and Cambridge in Ontario and communities such as Chilliwack and Kelowna in BC. Atlantic Canada has also continued a sharp upward trend, with Halifax condos seeing a 54 per cent price increase in the first half of the year. Though the market may see a downturn across the board in the next six months, prices in these fast-growing smaller cities will still likely see double-digit growth in 2023, continuing the upward pressure seen over the past five years.
Rushton says that market trends are evolving rapidly as the full effect of the rate changes will come into effect in the latter half of 2022. “We don’t want to get ahead of ourselves, we’re going to keep seeing how the market performs and whether or not it cools down after the frenzy of the past year. With inflation on the rise, folks may be less able to purchase but even a slight dip would only take us to the level of a few years back, possibly the 2018-2019 period. Ultimately, there are still buyers who have been waiting for a cool down period so that they can enter the market at the best time.”
Regional highlights:
Alberta
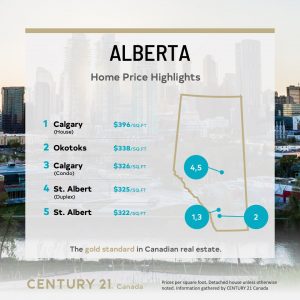
Moderate increases can be seen across regions in Alberta as investors from the GTA take advantage of growing smaller markets. While larger cities saw incremental growth, Okotoks and High River experienced double-digit increases, especially in their condo markets. The only decrease in this province can be found in St. Albert condos, though an increased PPSF in detached homes and duplexes indicate more families looking to grow in the suburbs.
Atlantic
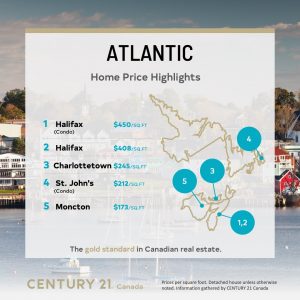
Atlantic Canada was again a hot market this year for young and first-time buyers who have been unable to purchase in other, larger metros. Halifax condo prices continued their meteoric rise, with a heavy demand for detached homes not that far behind. Double-digit increases are seen throughout the region.
“Everyone is eager to find a place where they can put down roots, and once the remote work mandates from the pandemic became permanent, we haven’t seen any signs of this market slowing down in the first half of the year,” says David Yetman, Owner of CENTURY 21 All Points. “The biggest question for the next year will be if the supply can keep up with the demand. While prime interest rates have had a slowing effect, it is temporary, the current BoC rate is still extremely low and it bodes well for a healthy Halifax Regional Municipality (HRM) market going forward.”
British Columbia

Once again, BC real estate takes the top place as the most expensive market in the country, particularly in detached homes in Vancouver’s West Side. However, the high prices may see buyers moving away from the downtown core as condo prices have only seen a slight increase this year (though remains the second highest local market, with a PPSF of $1,283) while prices rose sharply in communities such as Kelowna and Chilliwack, where condos saw a 28 per cent and 35 per cent increase in price respectively in the first half of the year.
Quebec
The Montreal condo market has held steady over the past year, with no increase to their PPSF of $935/sf. With the change in interest rates, there is the possibility of younger buyers who have been looking east in the recent years choosing to remain in their home province should prices trend down.
“The next six months will be watched very carefully to see how buyers, especially younger buyers, react to the changing interest rates,” says Mohamad Al-Hajj, owner of CENTURY 21 Immo-Plus. “While some may wait to see if there are any more changes, other buyers may see an opportunity to not have to move away from their communities.”
Ontario
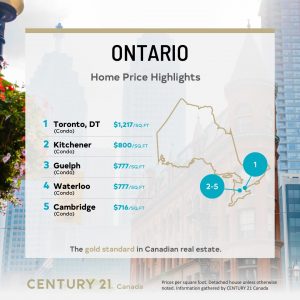
More buyers are leaving the Greater Toronto Area to seek homes in the communities such as Waterloo, Guelph and Hamilton. Guelph now stands at $777/sq ft, and Cambridge condos aren’t far behind at $716/sq ft.
Communities farther outside the GTA also saw substantial increases. Barrie saw a double digit increase in its detached home prices, as did Grey Bruce. As for the city of Toronto, after a slight downturn this time last year, prices have once agent risen to be the second highest in the country.
Prairies

The Prairies have seen a more modest growth in pricing than the rest of the country, but there have been rises across Manitoba and Saskatchewan. While Regina condo prices took a slight dip, the region’s detached homes are up by 13 per cent in the first six months of 2022. Winnipeg follows the trend, though at a lower growth rate of 11 per cent, and Saskatoon at seven per cent. Brandon may be an emerging market for younger buyers – while detached homes only saw a very slight single digit increase condos are up by nearly 20 per cent to $243/sq ft. Overall, prices in Prairie provinces have remained the steadiest over the past several years.
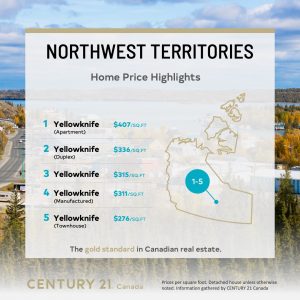
The upward trend of condos was even seen in Yellowknife, where a 14 per cent increase now sees the average apartment selling for $407/sq ft. More modest changes were seen across detached homes and townhouses, and only duplexes saw a small decrease.
CENTURY 21 Canada’s annual survey of data on the price per square foot (PPSF) of properties gathers and compares sales data from its franchises across Canada from January 1 to June 30 of each year. By looking at the price per square foot at the same time each year the firm is able to get a good idea of how prices have changed over time for similar properties. This year’s survey compares 2021 prices with this year’s results.
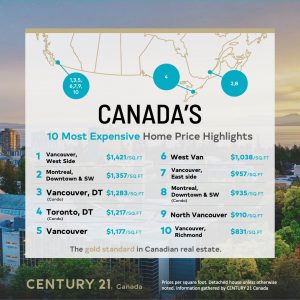
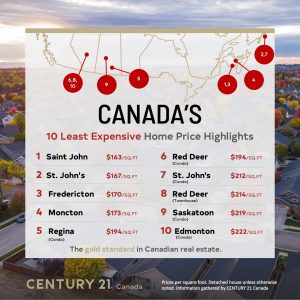
See full PPSF study results below:
ALBERTA |
|||||||
| CITY | HOUSE TYPE | 2018 | 2019 | 2020 | 2021 | 2022 | % Change from 2021 |
| Calgary | House | $341 | $325 | $320 | $355 | $396 | 11.55% |
| Calgary | Condo | $329 | $317 | $296 | $303 | $326 | 7.59% |
| Edmonton | Detached House | $288 | $272 | $268 | $284 | $297 | 4.58% |
| Edmonton | Duplex | $275 | $256 | $250 | $270 | $287 | 6.30% |
| Edmonton | Condo | $231 | $220 | $206 | $217 | $222 | 2.30% |
| High River | Detached House | $193 | $215 | $237 | $271 | $307 | 13.28% |
| High River | Condo | N/A | $241 | $173 | $176 | $223 | 26.70% |
| Okotoks | Detached House | N/A | $238 | $254 | $283 | $338 | 19.43% |
| Okotoks | Condo | N/A | $254 | $211 | $219 | $251 | 14.61% |
| Red Deer | Detached House | $276 | $262 | $252 | $289 | $293 | 1.38% |
| Red Deer | Townhouse | N/A | N/A | N/A | $207 | $214 | 3.38% |
| Red Deer | Condo | N/A | N/A | N/A | $186 | $194 | 4.30% |
| Red Deer | Duplex | N/A | N/A | N/A | N/A | $269 | N/A |
| St. Albert | Detached House | $287 | $271 | $269 | $289 | $322 | 11.42% |
| St. Albert | Condo | $239 | $223 | $211 | $251 | $238 | -5.18% |
| St. Albert | Duplex | $262 | $272 | $278 | $280 | $325 | 16.07% |
BRITISH COLUMBIA |
|||||||
| CITY | HOUSE TYPE | 2018 | 2019 | 2020 | 2021 | 2022 | % Change from 2021 |
| Chilliwack | Detached House | $297 | $294 | $288 | $406 | $515 | 26.85% |
| Chilliwack | Townhouse | $267 | $249 | $250 | $318 | $425 | 33.65% |
| Chilliwack | Condo/ Apartment | $283 | $290 | $270 | $351 | $473 | 34.76% |
| Kelowna | Detached House | $283 | $274 | $280 | $368 | $463 | 25.82% |
| Kelowna | Half Duplex | $247 | $260 | $263 | $320 | $402 | 25.63% |
| Kelowna | Townhouse | $292 | $287 | $302 | $365 | $452 | 23.84% |
| Kelowna | Apartment | $345 | $348 | $334 | $411 | $526 | 27.98% |
| Vancouver | Detached House | $856 | $769 | $816 | $975 | $1,177 | 20.72% |
| Vancouver, Downtown | Condo | $856 | $769 | $816 | $1,208 | $1,283 | 6.21% |
| Vancouver, East side | Detached House | $721 | $647 | $672 | $877 | $957 | 9.12% |
| Vancouver, West Side | Detached House | $1,147 | $990 | $1,004 | $1,208 | $1,421 | 17.63% |
| Burnaby | Detached House | $599 | $551 | $579 | $688 | $795 | 15.55% |
| West Van | Detached House | $899 | $738 | $734 | $971 | $1,038 | 6.90% |
| Vancouver, Richmond | Detached House | $677 | $598 | $608 | $722 | $831 | 15.10% |
| Delta North | Detached House | $423 | $400 | $413 | $570 | $716 | 25.61% |
| North Vancouver | Detached House | $681 | $613 | $690 | $794 | $910 | 14.61% |
| White Rock/South Surrey | Detached House | $506 | $472 | $435 | $625 | $795 | 27.20% |
| Victoria | Detached House | N/A | N/A | N/A | $558 | $592 | 6.09% |
| Victoria | Townhouse | N/A | N/A | N/A | $457 | $583 | 27.57% |
| Victoria | Condo | N/A | N/A | N/A | $659 | $676 | 2.58% |
ATLANTIC |
|||||||
| CITY | HOUSE TYPE | 2018 | 2019 | 2020 | 2021 | 2022 | % Change from 2021 |
| Charlottetown | Detached House | $147 | $165 | $178 | $211 | $245 | 16.11% |
| Fredericton | Detached House | N/A | $99 | $123 | $147 | $170 | 15.65% |
| Halifax | Detached House | $155 | $162 | $170 | $281 | $408 | 45.20% |
| Halifax | Condo | $228 | $239 | $270 | $291 | $450 | 54.64% |
| Moncton | Detached House | $101 | $106 | $124 | $142 | $173 | 21.83% |
| Saint John | Detached House | N/A | $111 | $123 | $134 | $163 | 21.64% |
| St. John’s | Detached House | N/A | $132 | $135 | $149 | $167 | 12.08% |
| St. John’s | Condo | N/A | $174 | $116 | $182 | $212 | 16.48% |
PRAIRIES |
|||||||
| CITY | HOUSE TYPE | 2018 | 2019 | 2020 | 2021 | 2022 | % Change from 2021 |
| Regina | Detached House | $254 | $246 | $237 | $250 | $284 | 13.60% |
| Regina | Condo | $236 | $213 | $205 | $205 | $194 | -5.37% |
| Saskatoon | Detached House | $270 | $263 | $263 | $314 | $336 | 7.01% |
| Saskatoon | Condo | $208 | $213 | $217 | $216 | $219 | 1.39% |
| Winnipeg | Detached House | $282 | $243 | $244 | $293 | $315 | 7.51% |
| Winnipeg | Condo | $261 | $220 | $223 | $234 | $254 | 8.55% |
| Winnipeg | Attached | N/A | $202 | $210 | $241 | $269 | 11.62% |
| Brandon | Detached House | $248 | $246 | $248 | $271 | $276 | 1.85% |
| Brandon | Condo | $196 | $204 | $204 | $203 | $243 | 19.70% |
ONTARIO |
|||||||
| CITY | HOUSE TYPE | 2018 | 2019 | 2020 | 2021 | 2022 | % Change from 2021 |
| Barrie | Detached House | $283 | $350 | $350 | $378 | $503 | 33.07% |
| Bradford | Detached House | $286 | $345 | $358 | $410 | $580 | 41.46% |
| Cambridge | Detached House | $332 | $355 | $388 | $450 | $625 | 38.89% |
| Cambridge | Duplex | $311 | $331 | $377 | $527 | $656 | 24.48% |
| Cambridge | Condo | $344 | $347 | $367 | $435 | $716 | 64.60% |
| Cambridge | Townhouse | $282 | $317 | $341 | $474 | $616 | 29.96% |
| Grey Bruce | Detached House | $175 | $182 | $195 | $357 | $455 | 27.45% |
| Guelph | Detached House | $397 | $409 | $443 | $483 | $690 | 42.86% |
| Guelph | Condo | $374 | $402 | $423 | $511 | $777 | 52.05% |
| Guelph | Duplex | $348 | $362 | $400 | $451 | $648 | 43.68% |
| Guelph | Townhouse | $311 | $335 | $364 | $433 | $641 | 48.04% |
| Hamilton | Detached House | $362 | $378 | $406 | $532 | $553 | 3.95% |
| Hamilton | Townhouse | $257 | $350 | $343 | $453 | $538 | 18.76% |
| Kitchener | Detached House | $339 | $359 | $400 | $430 | $618 | 43.72% |
| Kitchener | Semi-Detached | N/A | $341 | $399 | $460 | $623 | 35.43% |
| Kitchener | Townhouse | N/A | $323 | $342 | $435 | $576 | 32.41% |
| Kitchener | Condo | $328 | $362 | $399 | $483 | $800 | 65.63% |
| London | Detached House | $191 | $237 | $250 | $362 | $466 | 28.73% |
| Markham | Detached House | N/A | N/A | $485 | $557 | $685 | 22.98% |
| Niagara Falls | Bungalow | N/A | $336 | $395 | $475 | $630 | 32.63% |
| Niagara Falls | Detached House | N/A | $275 | $300 | $390 | $531 | 36.15% |
| Newmarket | Detached House | N/A | $372 | $510 | $505 | $516 | 2.18% |
| Ottawa | Detached House | $225 | $258 | $313 | $429 | $465 | 8.39% |
| Ottawa | Townhouse | N/A | N/A | N/A | $392 | $451 | 15.05% |
| Ottawa | Condo | $442 | $485 | $577 | $479 | $583 | 21.71% |
| Owen Sound | Detached House | $145 | $158 | $167 | $312 | $380 | 21.79% |
| Richmond Hill | Detached House | $445 | $465 | $522 | $520 | $665 | 27.88% |
| St. Catharines | Bungalow | $385 | $367 | $425 | $520 | $589 | 13.27% |
| St. Catharines | Detached House | $310 | $290 | $330 | $400 | $612 | 53.00% |
| Toronto, Downtown | Condo | $903 | $994 | $1,083 | $956 | $1,217 | 27.30% |
| Vaughn | Detached House | $434 | $503 | $548 | $612 | $695 | 13.56% |
| Waterloo | Detached House | N/A | $372 | $407 | $421 | $613 | 45.61% |
| Waterloo | Semi-detached | N/A | $357 | $399 | $439 | $648 | 47.61% |
| Waterloo | Townhouse | N/A | $324 | $344 | $408 | $641 | 57.11% |
| Waterloo | Condo | N/A | $402 | $411 | $503 | $777 | 54.47% |
| Windsor | Detached House | N/A | $372 | $407 | $295 | $306 | 3.73% |
QUEBEC |
|||||||
| CITY | HOUSE TYPE | 2018 | 2019 | 2020 | 2021 | 2022 | % Change from 2021 |
| Montreal, Downtown and SW | Condo | $567 | $709 | $805 | $935 | $935 | 0.00% |
| Montreal, Downtown and SW | Detached House | $603 | $674 | $958 | $1,350 | $1,357 | 0.52% |
NORTHWEST TERRITORIES |
|||||||
| CITY | HOUSE TYPE | 2018 | 2019 | 2020 | 2021 | 2022 | % Change from 2021 |
| Yellowknife | Detached House | N/A | N/A | $277 | $312 | $315 | 0.96% |
| Townhouse | N/A | N/A | $265 | $260 | $276 | 6.15% | |
| Manufactured | N/A | N/A | $267 | $290 | $311 | 7.24% | |
| Apartment | N/A | N/A | $347 | $357 | $407 | 14.01% | |
| Duplex | N/A | N/A | $306 | $343 | $336 | -2.04% | |
View Pirce Per Square Foot 2021 and Price Per Square Foot 2020
How the information was gathered by CENTURY 21 Canada
CENTURY 21 franchisees were asked to help come up with the average price-per-square-foot in their market. However, calculating a precise number is not an exact science as every office and province tracks statistics slightly differently. As a result, most have used the median price and square footage in their market in sales from January 1 – June 30, 2022. Each franchisee has confirmed that the numbers provided are an accurate representation of the trends market.
For more information please contact:
Peak Communicators
Shawn Hall
Phone: (604) 619-7913
Email: shawn@apogeepr.ca

 Facebook
 X
X
 Pinterest
 Copy Link
